


The S&P MidCap 400 SPDR (MDY) is trading at a moment of truth as its 5-day SMA returns to the 200-day SMA. A bearish trend signal triggered in early March. Despite a strong bounce from early April to mid May, this signal remains in force because it has yet to be proven otherwise. Today’s report will show how to quantify signals and reduce whipsaws using the percentage difference between two SMAs.
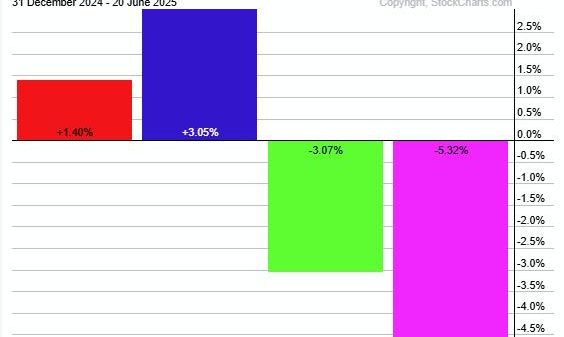
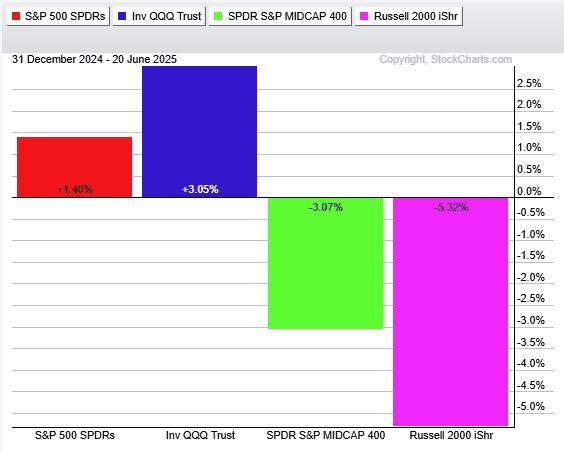
First note that MDY is lagging SPY and QQQ because its 5-day has yet to cross above its 200-day. The latter two saw bullish crosses in mid May, over a month ago. A bullish breakout in MDY would reflect broadening upside participation, which would be bullish for stocks. The PerfChart below shows SPY and QQQ with year-to-date gains. MDY and IWM are down year-to-date.
***********************
TrendInvestorPro continues to follow the leading uptrends and recent breakouts in metals-related ETFs. These include gold, silver, palladium, platinum, copper and associated miners. Tech-related ETFs are also leading and featured in our reports/videos. Click here to learn more and get full access to our research.
***********************
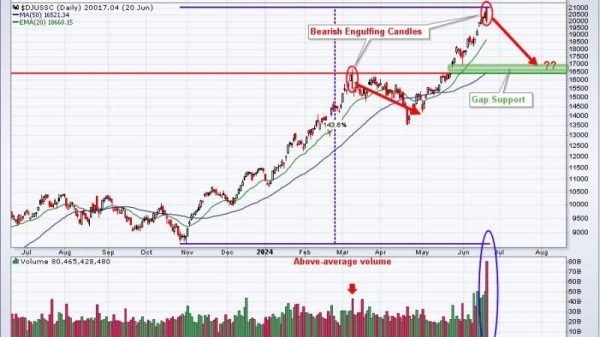
The chart below shows MDY hitting its moment of truth as the 5-day SMA (black line) bumps against the underside of the 200-day SMA (blue line). A bearish cross occurred in late February and this signal has yet to be reversed. However, I am not watching for a simple 5/200 cross. Instead, I want to see the 5-day SMA clear the 200-day SMA by a certain percentage. This is a signal threshold.
The indicator window shows Percent above MA (5,200,1), which measures the percentage difference between the 5 and 200 day SMAs. See the TIP Indicator Edge Plugin for details. I placed signal thresholds at +3% and -3% to reduce whipsaws. A bullish signal triggers with a move above +3% and a bearish signal triggers with a move below -3%. At the very least, this indicator value is still negative and bearish. A move above 0 would reflect a positive 5/200 cross, while a move above +3% would trigger a bullish trend signal. This indicator is part of the TIP Indicator Edge Plugin for StockCharts ACP.
The signal threshold levels depend on your personal preferences and trading styles. Tighter thresholds generate earlier signals, but with more whipsaws. Wider thresholds reduce whipsaws, but increase signal lag. This is always the tradeoff. I prefer plus/minus 1 percent when using the 5/200 cross for SPY. I widened these thresholds to plus/minus 3 percent for MDY because it is more volatile.
TrendInvestorPro continues to follow the leading uptrends and recent breakouts in metals-related ETFs. These include gold, silver, palladium, platinum, copper and associated miners. Tech-related ETFs are also leading and featured in our reports/videos. Click here to learn more and gain immediate access.